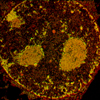
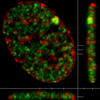
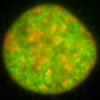
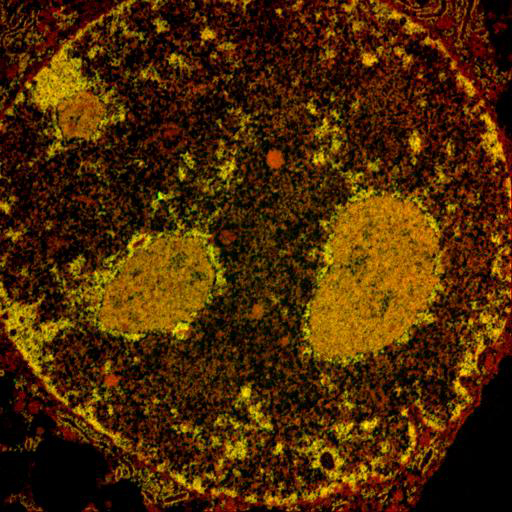
 This image is an electron spectroscopic imaging (also known as energy filtered transmission electron microscopy) image of a mouse 10T1/2 fibroblast nucleus. Quantitative distributions of phosphorus, which highlights DNA and RNA due to its inherent high phosphorus content were false-coloured green. Quantitative spatial maps of nitrogen distribution, which highlights protein, DNA, and RNA, is shown in red. Moving your mouse over the image will reveal clickable links where more information and images of this structure can be found. In internet explorer, a label will appear for each region if you pause mouse over the site for a few seconds. To learn more about electron spectroscopic imaging click here.. Click on the image to see more TEM images of nuclei and nuclear components. |