
Can force reach the nuclear interior?
The archive asks whether cell deformation is accompanied by movement inside the nucleus. These historical movies illustrate nuclear motion during the labelled experiments. Motion alone does not measure transmitted force: loading, image registration, probe coupling and an appropriate mechanical model are needed to distinguish deformation from drift or other movement. Tracking model and sampling study.
Mouse cell nuclei under tension
Montage of nuclei in mouse cells alongside a phase-contrast field. The question driving the experiments: do nuclear structures move when the cell is stretched?
Splicing factor compartments in a live nucleus
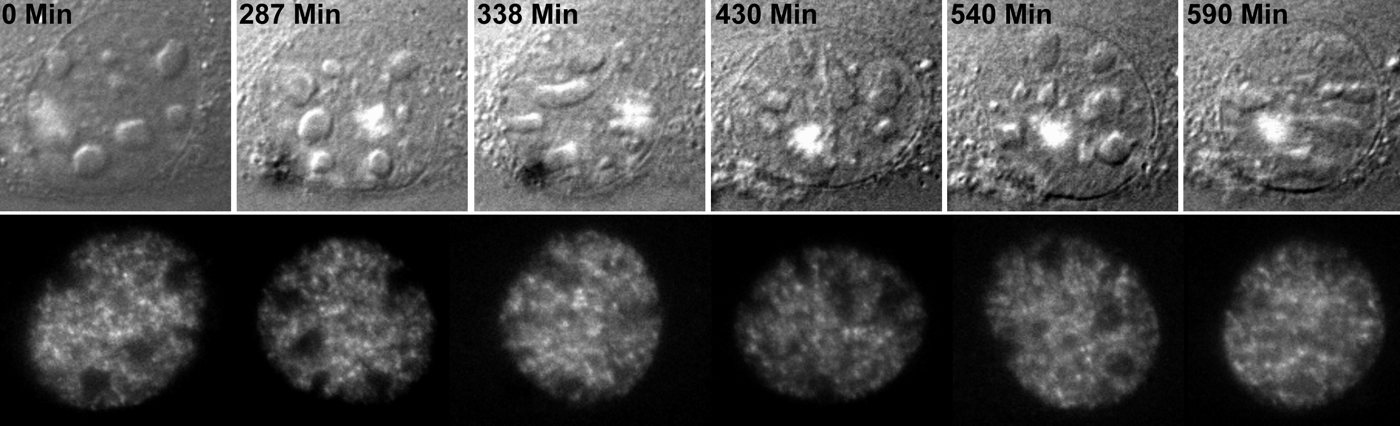
A GFP-labelled nucleus whose speckle-like compartments are followed over a timed sequence.
Tracking SFC movement
Tracks of individual splicing factor compartments (SFCs) in a nucleus under tension; coloured paths trace the motion of selected compartments.
Seeing the nucleus with energy-filtered TEM
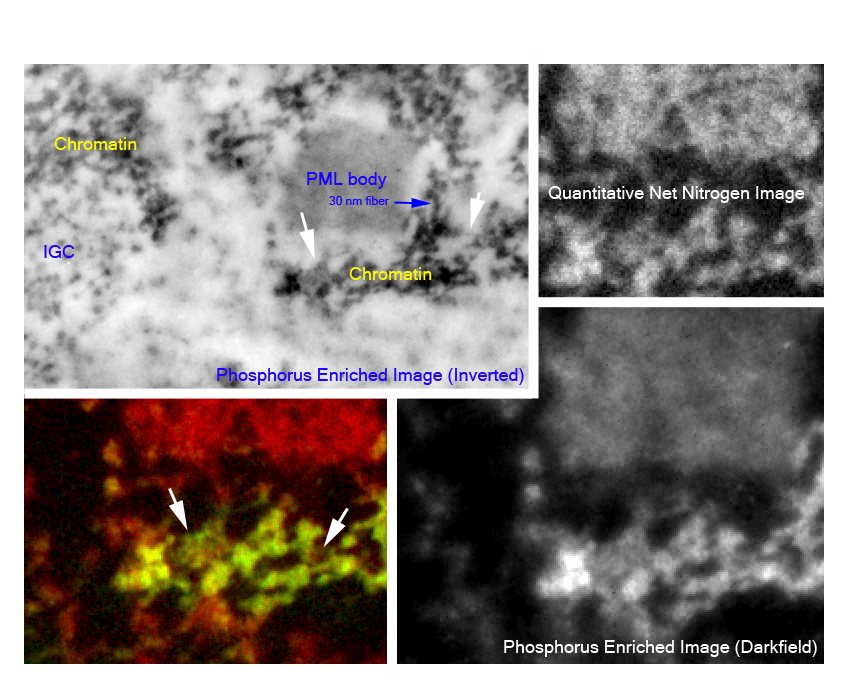
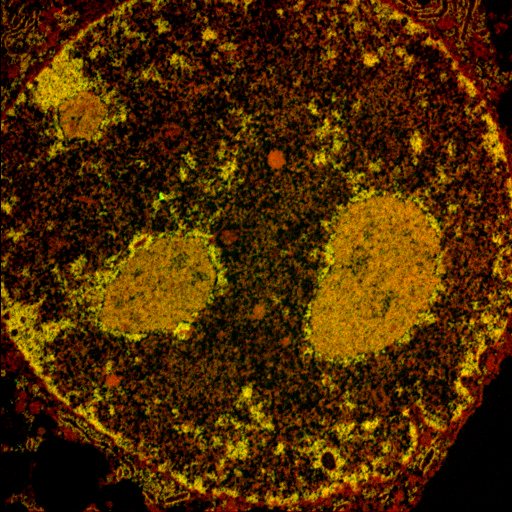
Energy-filtered transmission electron microscopy (EFTEM), used for electron spectroscopic imaging, maps elemental phosphorus and nitrogen. Phosphorus enrichment helps locate nucleic-acid-rich structures, while mass and nitrogen information help distinguish protein-rich regions. These are elemental signals: phosphorus is present in both DNA and RNA, and nitrogen is not exclusive to protein. Assignment to a particular molecule and quantitative modelling require suitable controls, calibration and structural or correlative information. ESI method study.
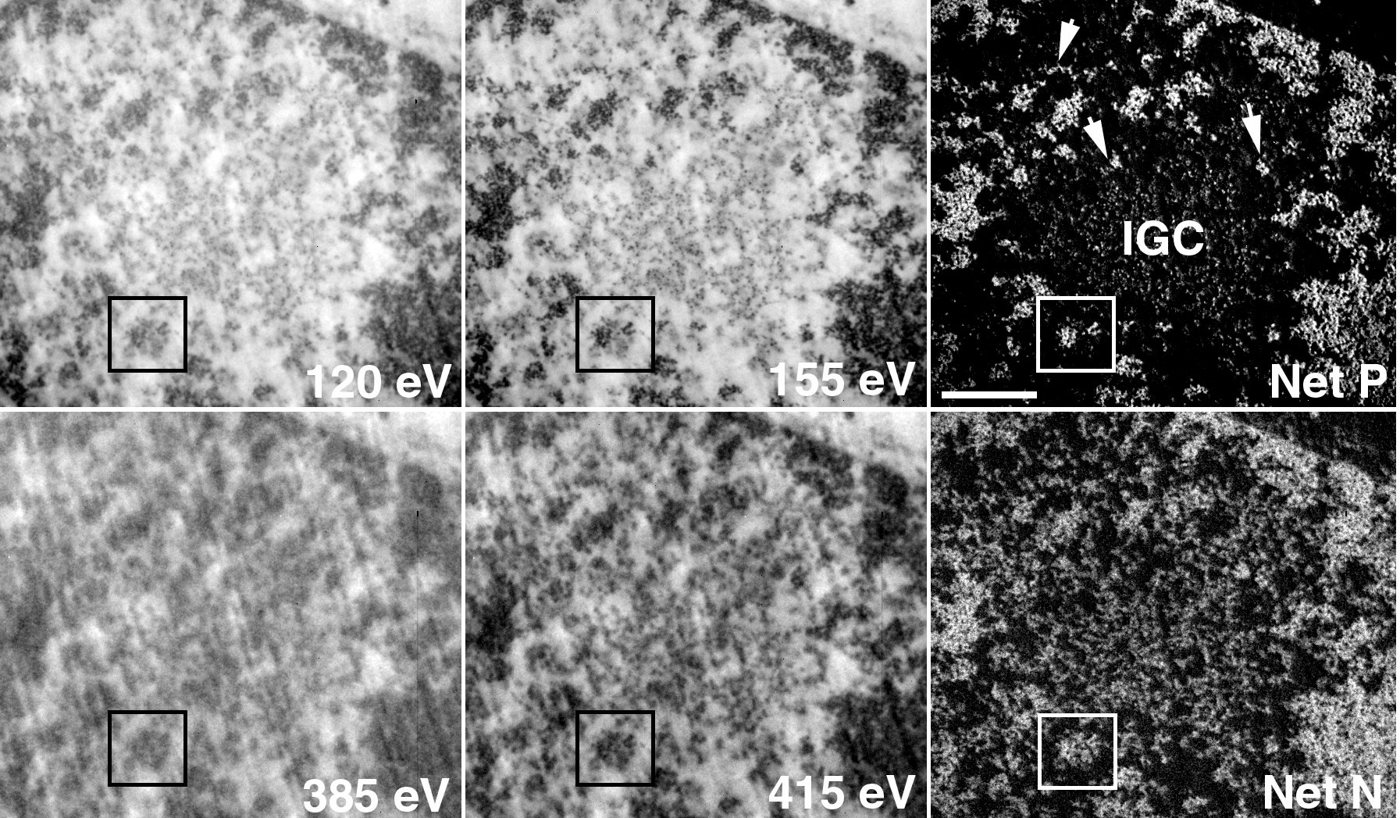
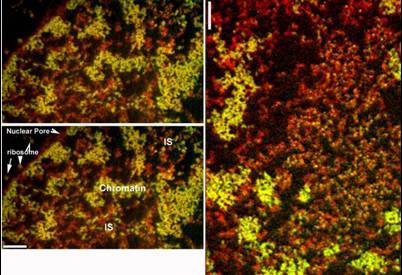
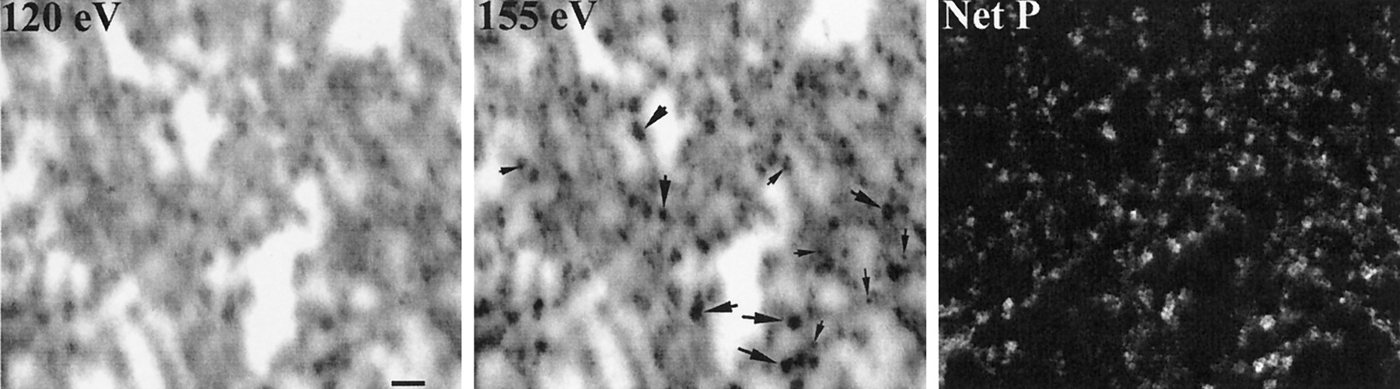
Series of EFTEM sections
A short series of EFTEM images of nuclear material, stepping through successive images.
Tracking splicing factor compartments
Splicing factor compartments (SFCs) are the nuclear speckles that concentrate pre-mRNA splicing factors. Tracking fluorescent compartments can describe their displacement and changes over the recorded interval. A trajectory does not by itself identify the force, motor, or chromatin interaction responsible for the motion. SC35 is retained here as the historical staining label; the reagent and its molecular target have not been independently matched to the archive. Ilik et al. 2020. Tracking model and sampling study.
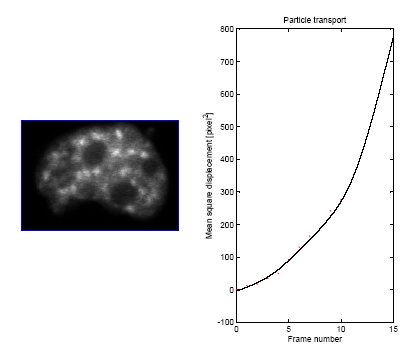
GFP-tagged HeLa nucleus
Three-dimensional time-lapse of a HeLa nucleus; box shows the imaged volume.
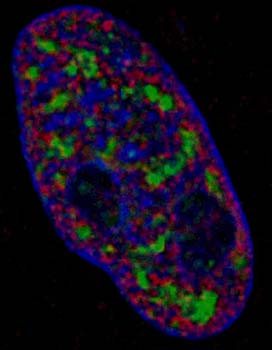
SC35 compartments in 3D
3D rendering of an Indian muntjac nucleus with chromatin and SC35-labelled compartments.
Particle tracking with 40 nm beads
The archive labels these probes as 40 nm fluorescent beads. Their trajectories sample the environment accessible to that probe, with possible contributions from excluded volume, binding and confinement. They do not directly measure a universal nuclear viscosity. The paired diffusion simulations are model outputs whose comparison with experimental motion requires calibration, boundary conditions and checks on probe size and interactions. Tracking model and sampling study.
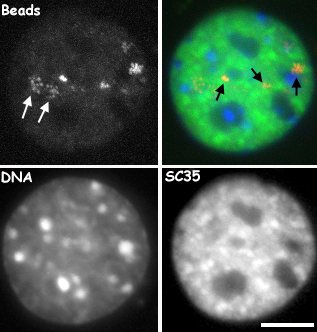
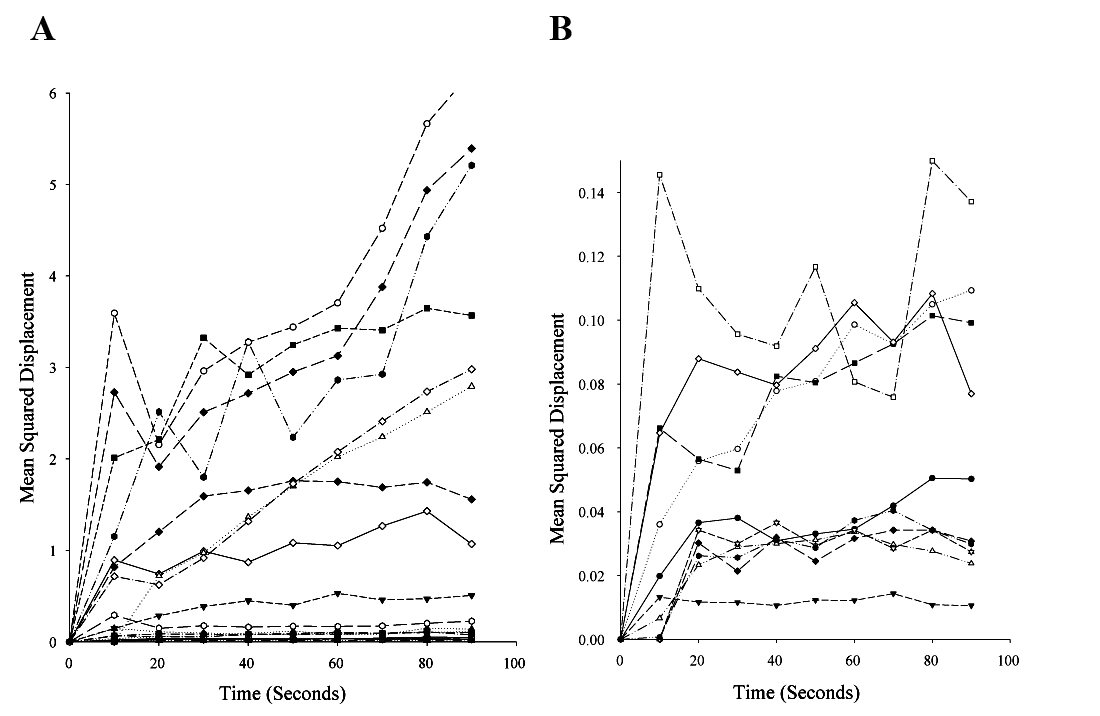
Beads, DNA and SC35 together
Four-panel time-lapse (beads, DNA, SC35 and merge) from the bead-tracking experiments.
Bead movement at high magnification
High-magnification view of beads within a nucleus, with an enlarged inset (right).
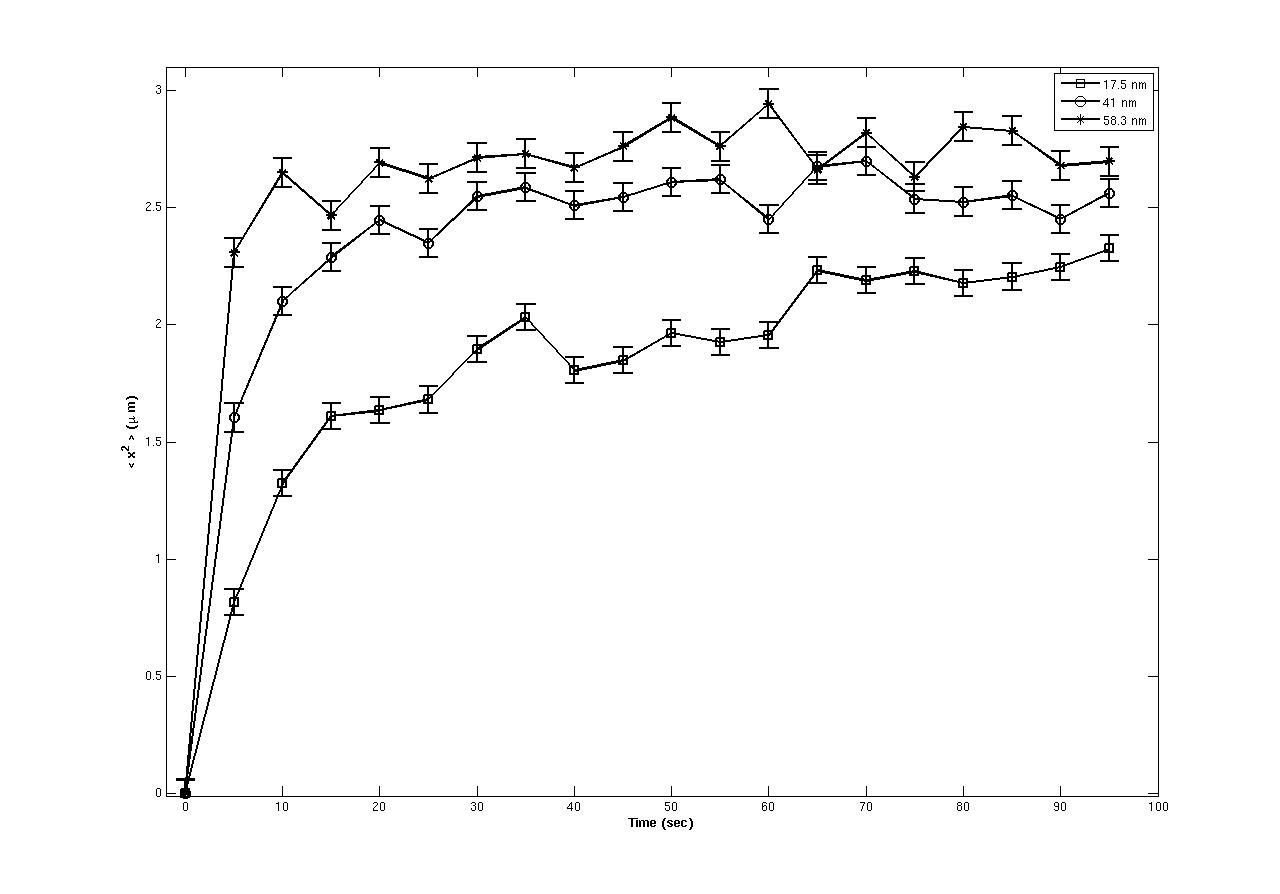
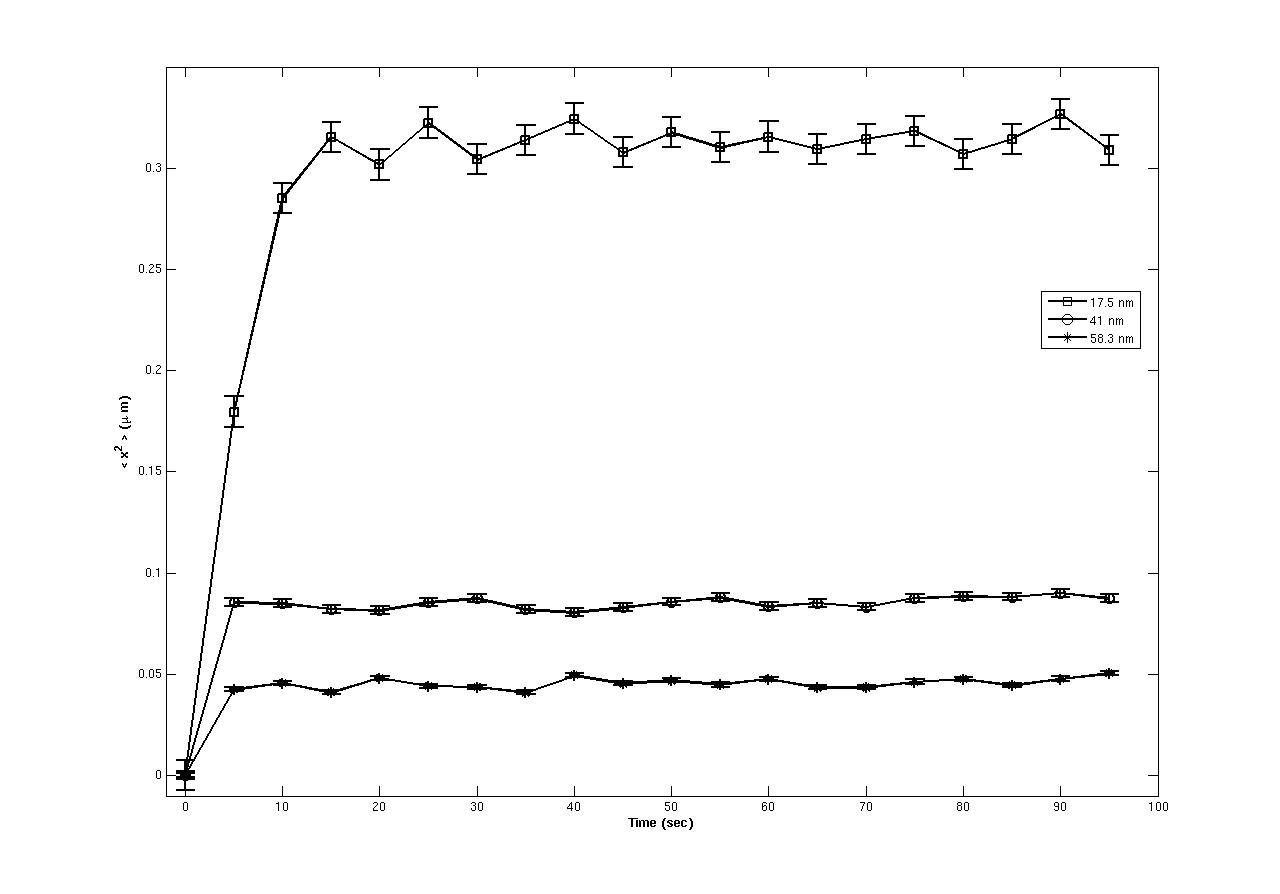
Restricted PML-body trajectories in the archive
The labelled PML-body trajectories explore limited regions during these recordings. Restricted displacement is compatible with confinement or tethering, but does not identify which surrounding structure is responsible or establish the same behavior in every cell state. Tracking model and sampling study.
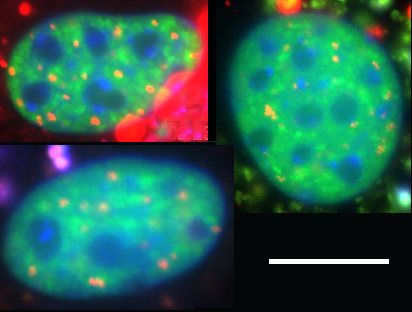
PML body movement
Time-lapse of PML bodies (red) within a nucleus; timestamps in minutes.
Two-colour nucleus, 36-minute series
Single-channel and merged views of one nucleus followed across a 36-minute time course.
DIC and fluorescence of the same cell
DIC view (left) and fluorescence of the nucleus (right) over a 24-minute series.
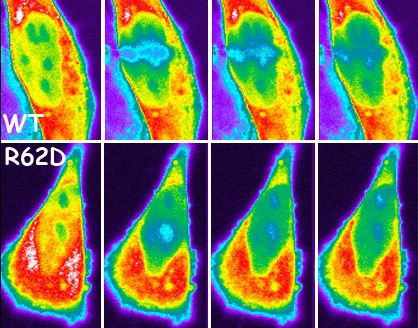
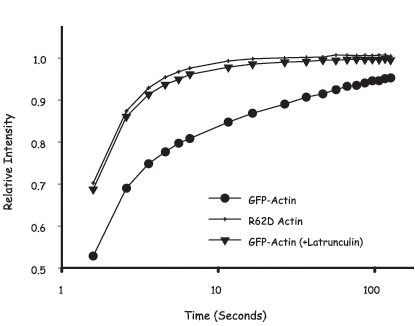
Nuclear actin dynamics by FRAP
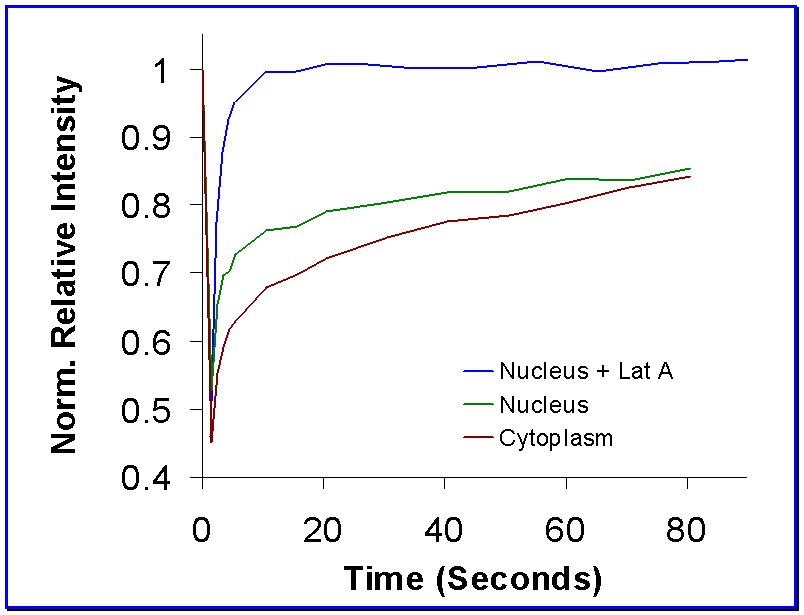
Fluorescence recovery after photobleaching of GFP-actin compares wild-type and mutant reporters and latrunculin perturbation. McDonald and colleagues (2006) used recovery modelling and polymerization-competence comparisons to support a slow nuclear actin pool. Recovery combines diffusion and association kinetics; it does not directly display filament geometry or independently determine a universal polymer fraction. McDonald et al. 2006. FRAP model study.
Organization of the genome at the nanoscale
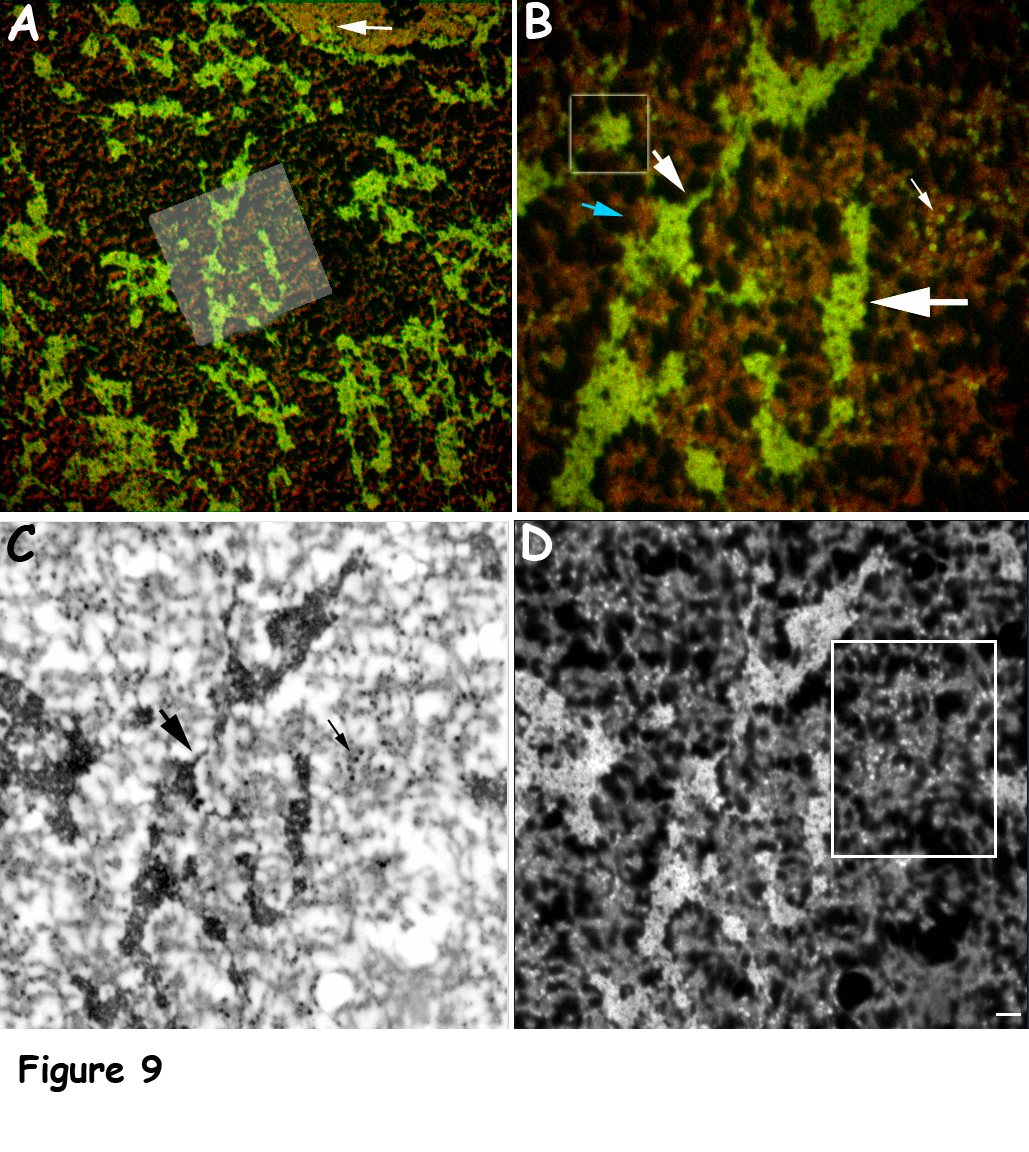
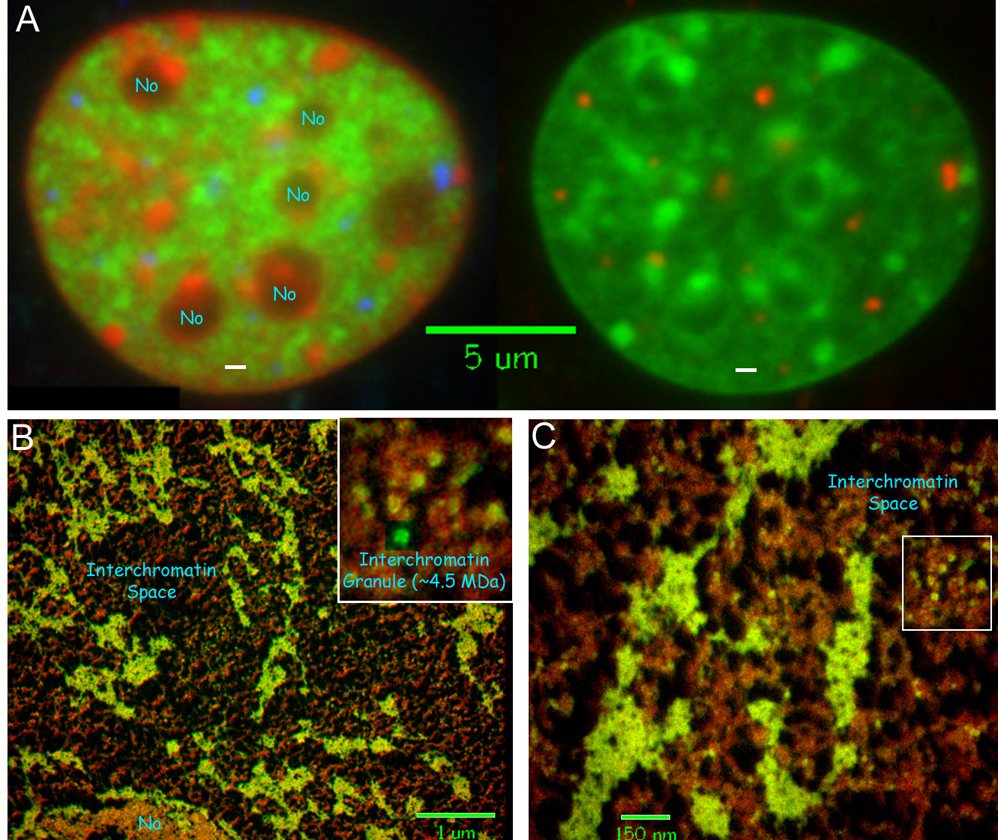
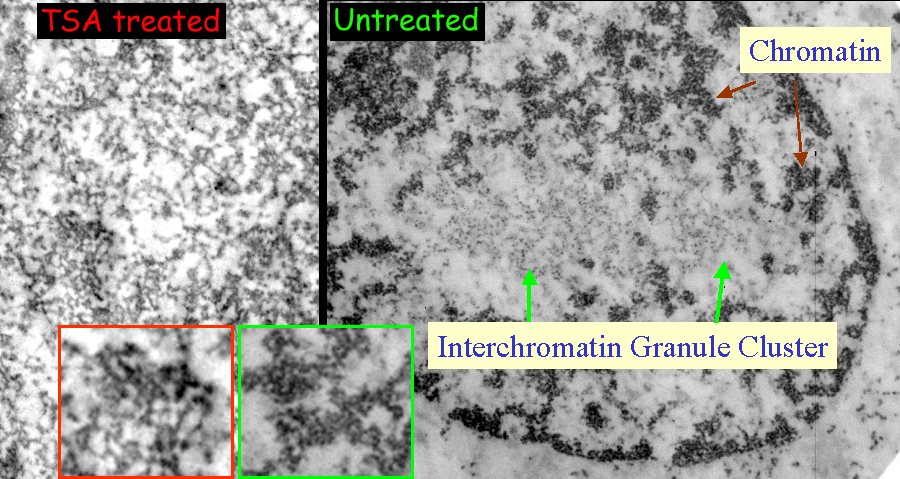
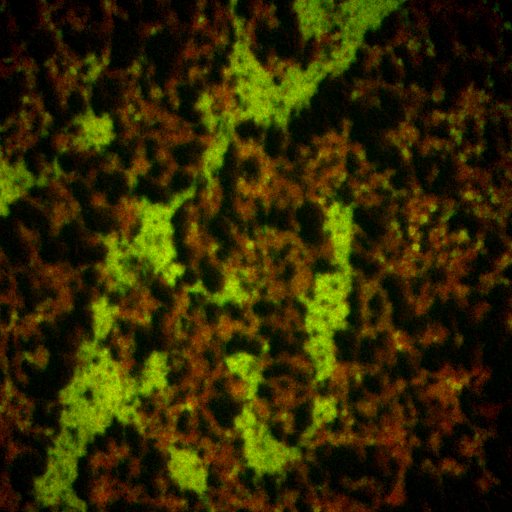
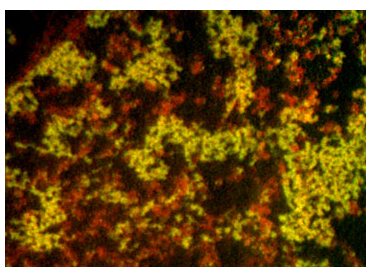
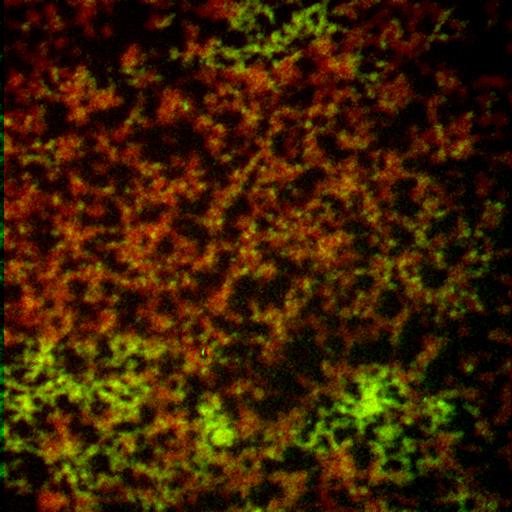
Returning to EFTEM, the final part looks at how DNA is packed in situ. Phosphorus and nitrogen maps show heterogeneous nucleic-acid and protein distributions at the scale sampled by the experiment. These archive panels illustrate chromatin-associated texture and interchromatin space; they do not establish a universal regular 30 nm fiber or its genomic prevalence. Structural conclusions depend on specimen preparation, molecular contrast and effective resolution. ESI method study. MINFLUX primary study.
Acknowledgements
Hendzel lab members Darin McDonald, Christi Andrin, Kirk McManus, Ellen Crawford, Carmen Tomkinson, Ming Ye, Rohyun Sung and Jianxun Han, with John Th’ng (Northwestern Ontario Regional Cancer Centre) and Joan Turner (Cross Cancer Institute).
How to interpret this imaging archive
Scientific narrative updated 12 October 2026 after checks in Consensus, SciSpace, Scite and primary publication records. The linked studies establish method and interpretation limits; they do not authenticate every local movie, its loading history, or its annotations.
Recent structural evidence also needs a narrow interpretation. Xie and colleagues reported selected fiber-like DNA localization patterns in living U2OS nuclei using an AT-preferring MINFLUX probe. Probe selection, sampling and potential dye effects limit generalization to all chromatin or a regularly ordered nucleosome fiber. See the 2025/2026 primary study and the chromatin-fiber evidence review.
- Hendzel and Bazett-Jones (1996), Probing nuclear ultrastructure by electron spectroscopic imaging: primary abstract and publication identity checked; detailed original acquisition calibration was not reanalysed.
- Bazett-Jones, Locklear and Rattner (1988), Electron spectroscopic imaging of DNA: primary abstract and identity checked for elemental contrast in defined specimens.
- McDonald et al. (2006), Nucleoplasmic beta-actin dynamics: primary reported FRAP and mutant comparisons checked; archived clips were not linked frame by frame to published figures.
- Sprague et al. (2004), Analysis of binding reactions by FRAP: primary abstract checked for diffusion, binding and parameter-identifiability limits.
Original movie-to-experiment mapping, quantitative calibration, every visual annotation and reuse permissions remain unresolved. Element maps, localization clouds and simulated trajectories represent different observables.